Methodical Snark critical reflections on how we measure and assess civic tech
Tag

visualization

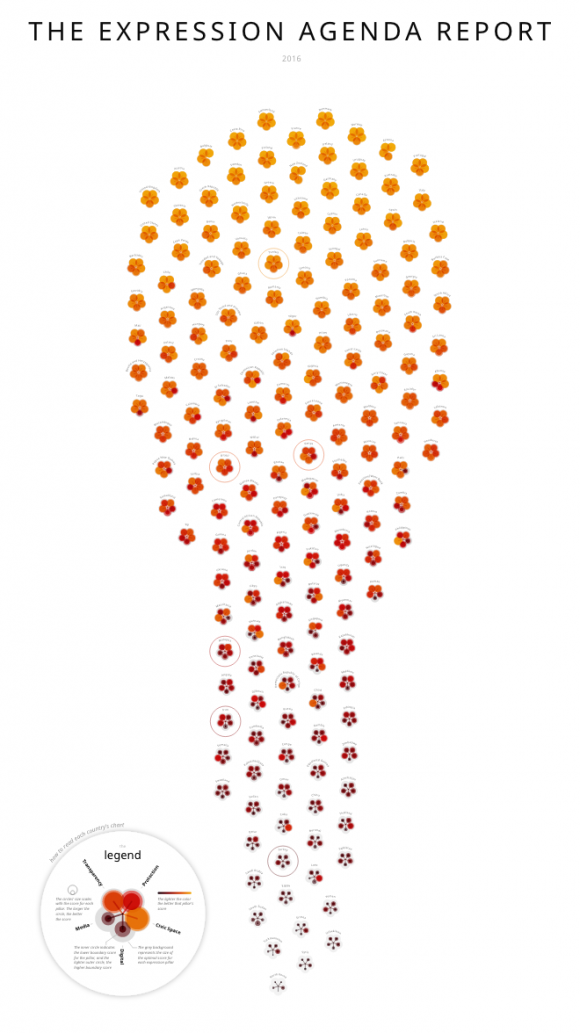
Yet another comparative metric on freedom of expression (kind of)

The Expression Agenda (XpA) was just released by Article19. It's rather prettier than most, and nice to see free expression data in something other than a map or a list; but really, do we need this? The metric doesn't contribute any new data, and the visualization is hard to parse. The report buried in the background is more important by far, but likely only for advocacy on global policy.

Roundup: strategies for institutionalization in govt, social media activism is stressful, and nobody reads research.

Findings Social media activism is stressful– At least in Pakistan, according to a recent survey (N=237, convenience sample) which found significant correlations between stress levels and political activism on social media. Users of Greece’s national transparency and anti-corruption website say they trust government more since the website was established (web survey n=130, availability...

research links w 23-24 / 17

Findings Research on nearly 3 decades of democratic innovation and e-participation in Latin America has some interesting findings (Brazil, Colombia, Mexico and Peru). According to an Open Democracy blogpost (the actual project’s website is down): civil society participation programming uses tech more often than not, smaller countries are less prolific than large countries in terms of tech...

research links w 13-17

Findings @bbcmediaaction ‏ sums up research on social media in development, finds little evidence of impact, and notes that most researcher on the subject is focused on the Arab uprisings of 2011-2012. Community @GlobalIntegrity ‏ continues to set the standard for best practice in governance assessments. They’re about to release provisional 2016 African Integrity data for a 2 month peer...

research links w 12- 17

Findings Politically marginalized groups have less access to the internet, worldwide. This shocker based on network measurements over 8 years and identification of politically relevant groups as defined by the Ethnic Power Relations (EPR). The relationship between online and offline activism is messy, according to a survey of 1023 adolescents from five Balkan countries, while a year-long study in...

research links w 3/17

Papers & Findings What makes multi stakeholder initiatives for transparency effective? In the case of EITI, it seems to be treating civil society  as equal partners and ensuring that they bring relevant technical skills to the table. This according to doctoral research that also outlines common “pathways to proactive transparency reform.” Would be great to see research testing...

State of research: data visualization

Data visualization is all the rage in advocacy circles. Activists and development orgs are doing it all the time, often without formal mandates or training. This tends to go unquestioned, because  it’s easy to adopt a “good enough” approach to peripheral activities from the trenches of campaigning, and because visualization and design are things that a lot of us like to think...

Methodical Snark critical reflections on how we measure and assess civic tech

Tags